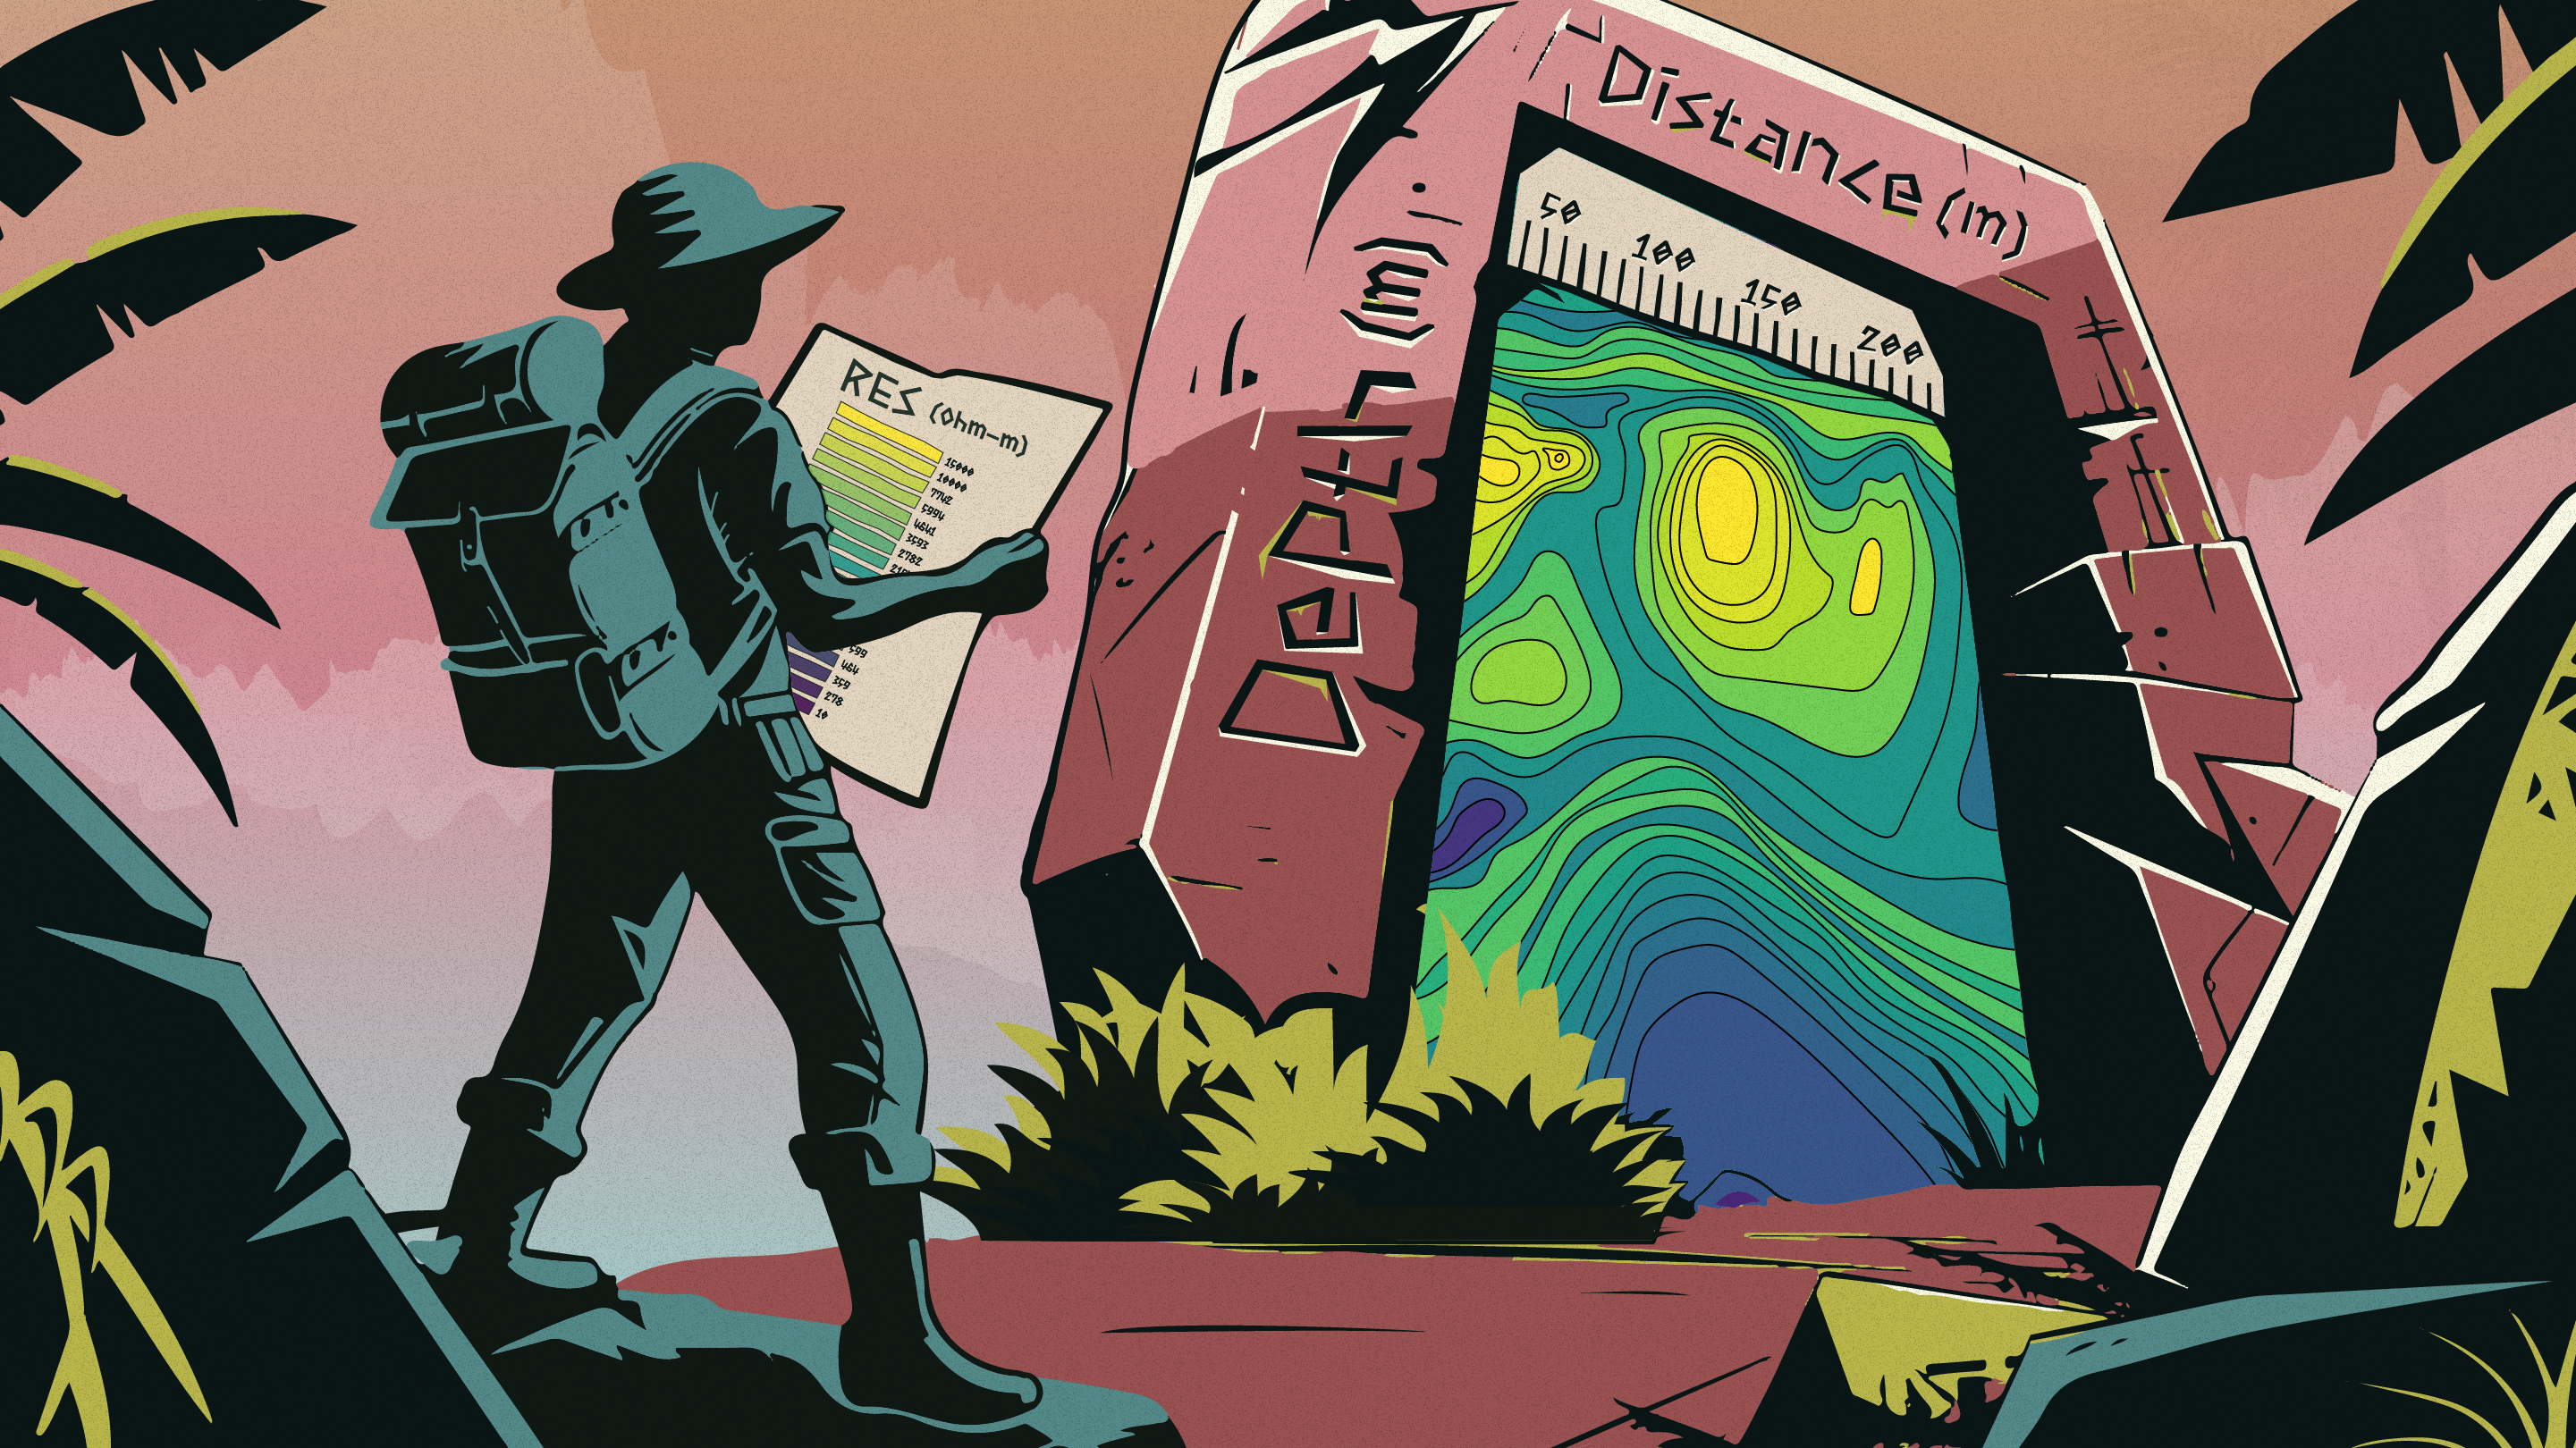
Every dataset tells a unique story in electrical resistivity imaging (ERI). For experienced professionals and academics, the challenge often lies in interpreting this narrative from the inverted data. This involves identifying important subsurface features such as groundwater, voids, contamination plumes, and other significant aspects.
In previous posts, we discussed the key factors to consider when analyzing groundwater exploration and dam monitoring data. Today, let's broaden the scope.
We receive many queries from our clients regarding interpretation, and while the specifics may vary from case to case, some general trends are often observed. Simply put, data interpretation is a nuanced split between geological knowledge and field experience.

Understanding the Influences on Resistivity Data
ERI data interpretation is complex and influenced by various factors, including geological formation, porosity, target size, and moisture content. For example, air-filled voids typically exhibit high resistivity due to air having few conductive pathways. However, this interpretation is complicated when other materials or conditions come into play. Highly resistive rock types or dry soils might also display similar high resistivity values, making a void appear larger—while conductive minerals or smaller filled voids could show lower resistivity anomalies. This necessitates a nuanced analysis that considers all possible influencing factors.
Influence of Adjacent Materials on Resistivity Readings
Adjacent Conductive Materials:
Due to their moisture content and ionic composition, materials like clay or saline groundwater are naturally conductive. When these materials encircle or lie near a void, they can significantly lower the area's overall resistivity reading, potentially leading to an underestimation of the void’s size or a complete miss in its detection.
Adjacent Resistive Materials:
Conversely, highly resistive materials such as dry sand or compact rock can increase the resistivity contrast between a void and its surroundings. While this might seem beneficial for detection, it can also lead to overestimating the void’s extent. Moreover, if resistive materials partially or fully encase a void, they may obscure its presence, resulting in false negatives.
Layering Effects:
Geological layering can create complex resistivity patterns that are challenging to interpret. A conductive layer situated over a resistive one might obscure deeper resistive features, including voids, requiring careful analysis to decipher the stratification accurately.
Common Mistakes in RES/IP Data Interpretation
Several common errors can lead to misconceptions and costly missteps. One prevalent mistake is overlooking the influence of background noise and interference, which can skew the true resistivity and IP readings, leading to false anomalies or obscured features. Of course, we recommend the SuperSting system and AGI cables—since it produces clean data in many user cases.
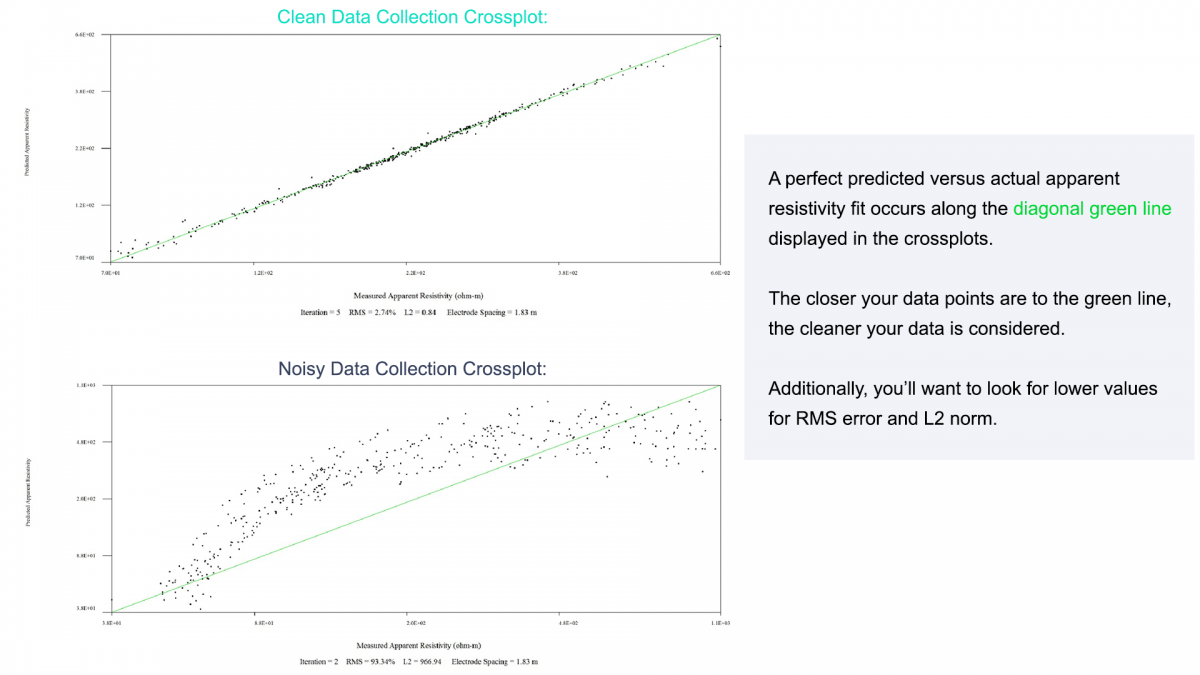
Above: During the data modeling process, a Data Misfit Crossplot is displayed to check how well the calculated (predicted) apparent resistivity fits the corresponding measured apparent resistivity. A perfect predicted versus actual, apparent resistivity fit occurs along the diagonal green line displayed in the cross plots. Acceptable data misfit or “goodness of fit” occurs when the maximum RMS error is less than 10 percent or “L2” (another data misfit indicator) is about 1. The very low RMS error (2.74%) and L2 value (0.84) for the top cross plot indicate high-quality inversion results. Crossplots taken from a customer comparison of passive electrode cables.
Another error is the overreliance on or misattribution of resistivity values. For instance, high resistivity might not always signify dry conditions or voids but could instead indicate the presence of low porosity resistive rocks like granite. Professionals sometimes fail to integrate RES/IP data with geological and hydrological contexts, resulting in a lack of understanding of the underlying processes affecting the data, such as clay content or saline intrusion, which are crucial for accurate interpretations. For some typical resistivity ranges, check out this blog post.
Additionally, neglecting the scale of investigation can lead to misinterpretations, as small-scale features might be overlooked when focusing solely on broader anomalies.
Lastly, inadequate calibration and standardization of equipment before surveys often lead to inconsistent data, complicating the analysis and comparison across different survey areas or times.
Interpretation Tips
Obtaining Public Records For Your Survey Site:
Obtaining public geological records is an essential first step before commencing any survey. These records are invaluable during the data interpretation phase as they provide comprehensive information on the known geology of the area, including details about the water table, mineral layers at various depths, and other geological features.

Here’s an extra tip: Commissioning a detailed geological report from consultants is often possible for a reasonable fee. These reports can offer critical insights into the specific geological characteristics of your survey area, such as the presence and location of fractures, aiding significantly in planning and analysis.
Collect Enough Data For Your Target
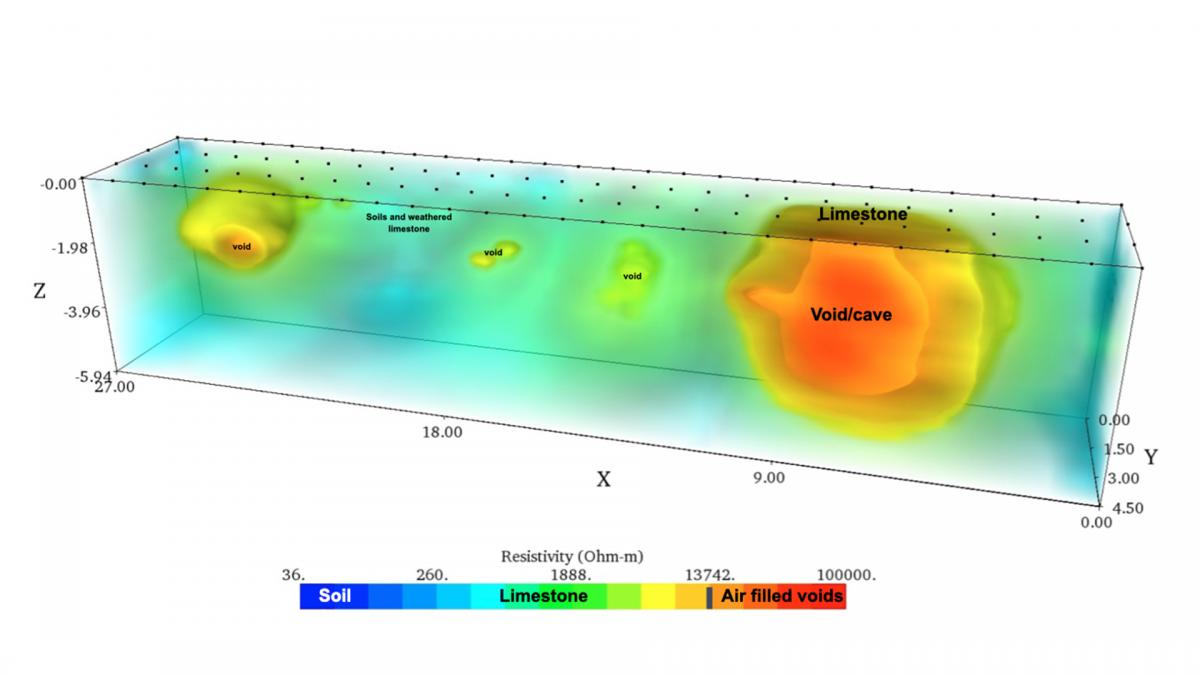
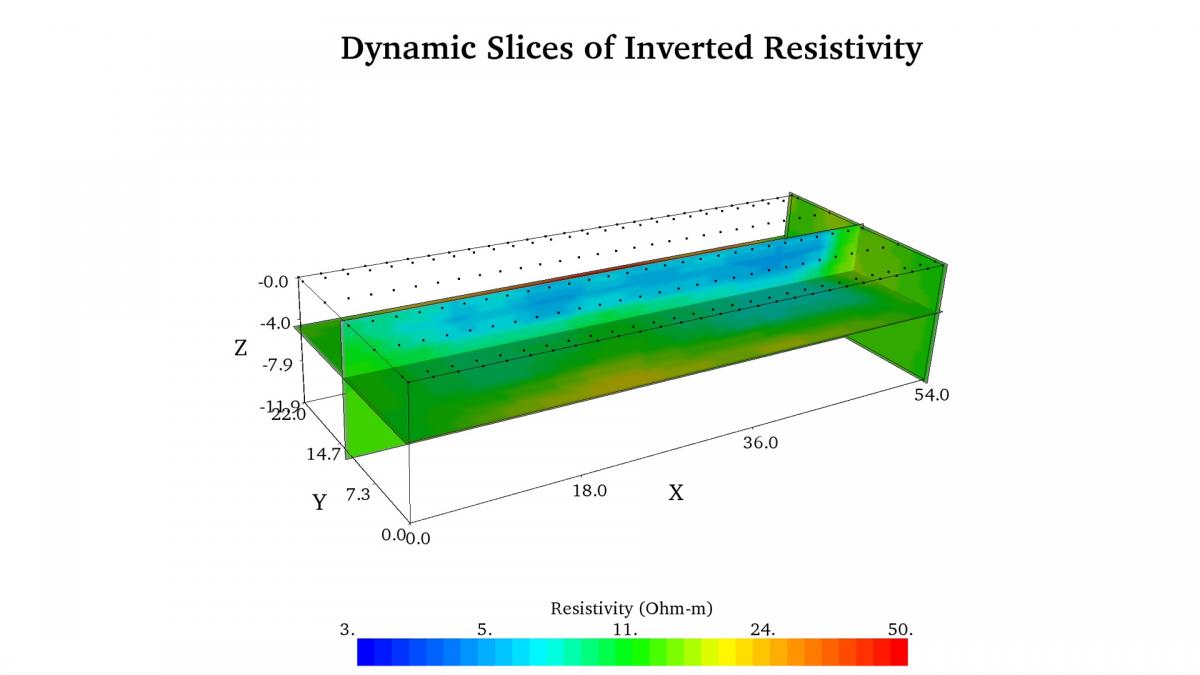
Before heading into the field, it's important to determine how much data you require. Are you aiming to simply get a general idea of the location of your target, or do you need to gather detailed information such as depth and volume? This is particularly important when interpreting features such as caves and paleochannels. As illustrated below, these types of features have complex overall shapes that cannot be accurately captured by a single vertical slice of 2D data.
Don’t Rely On Resistivity Values Alone
When interpreting data, it is important to look beyond resistivity values and focus on recognizing patterns and shapes. While resistivity values are significant, they cannot provide a complete picture on their own. A combination of values, patterns, and shapes will most effectively interpret data.
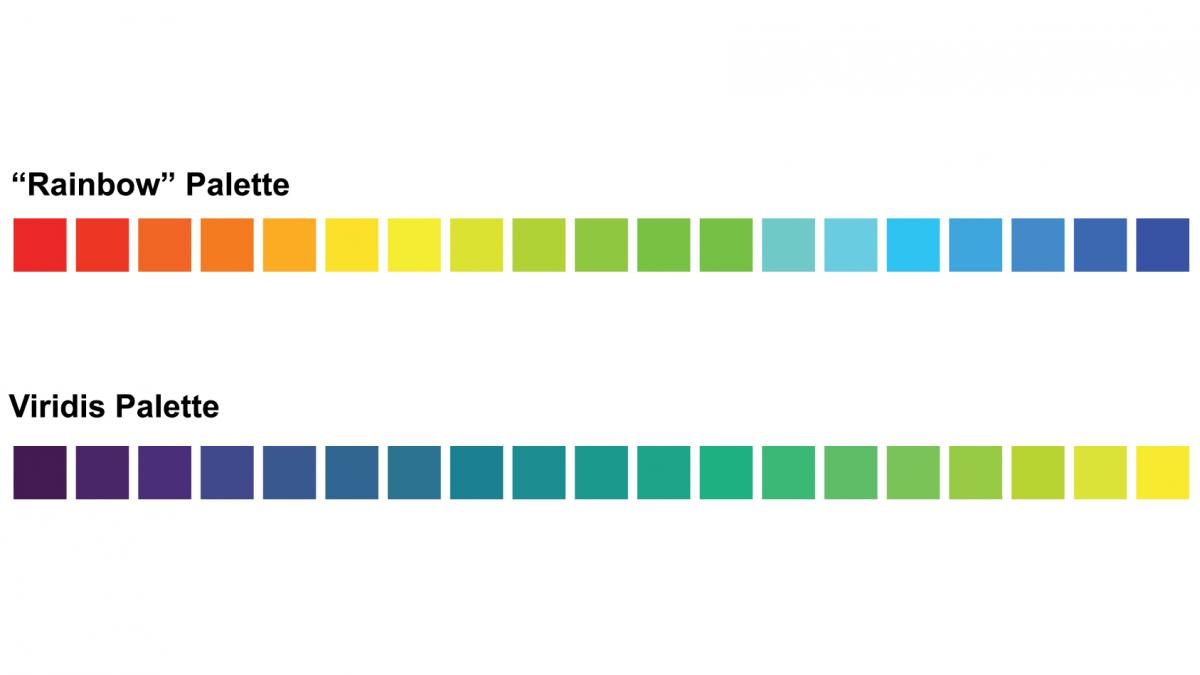
Play With Color Scales
Adjusting the color scales of the inversion sections can be an effective technique to aid in this process. For instance, software like EarthImager™, which offers various custom and preset color patterns, can provide different perspectives on the anomalies. Adjusting these color scales can highlight subtle features and variations within the data, making distinguishing between geological structures and anomalies easier. Bonus tip, using a Viridis color scale can help those with color blindness see data contrasts better.
Recognizing patterns and shapes within resistivity values
Pattern and Shape Recognition for Groundwater, Faults, And Fractures:
You may be tempted to consider any low-resistivity value to be water since water is often highly conductive. But remember, you can’t rely on resistivity values alone.
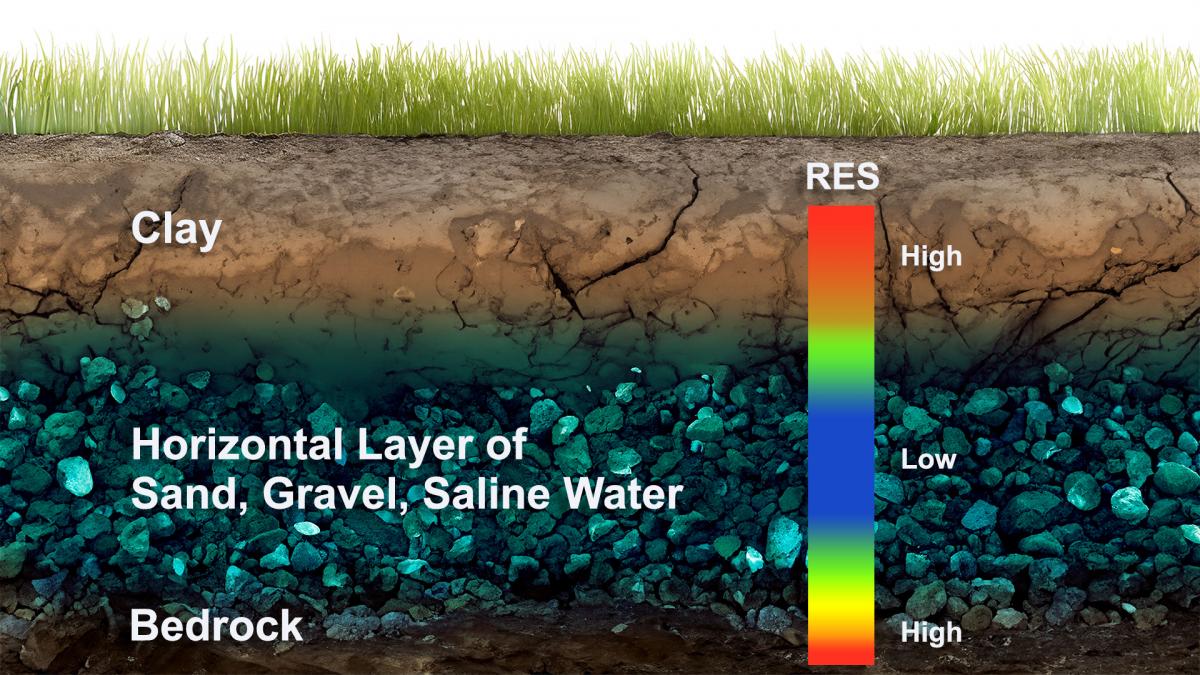
Low resistivity values can be interpreted differently depending on the type of water. Freshwater typically ranges from 10 to 100 ohm-meters (50 to a couple hundred in aquifers), but saline water is less than 10 ohm-meters. When analyzing groundwater data, it is important to pay attention to resistivity values based on your knowledge of the location’s geology, specific data patterns, and shapes resembling subsurface makeup.
For instance, when surveying saline water in sediment, you should look for continuous, horizontally extended patterns of lower resistivity that indicate water saturation in interbeds.
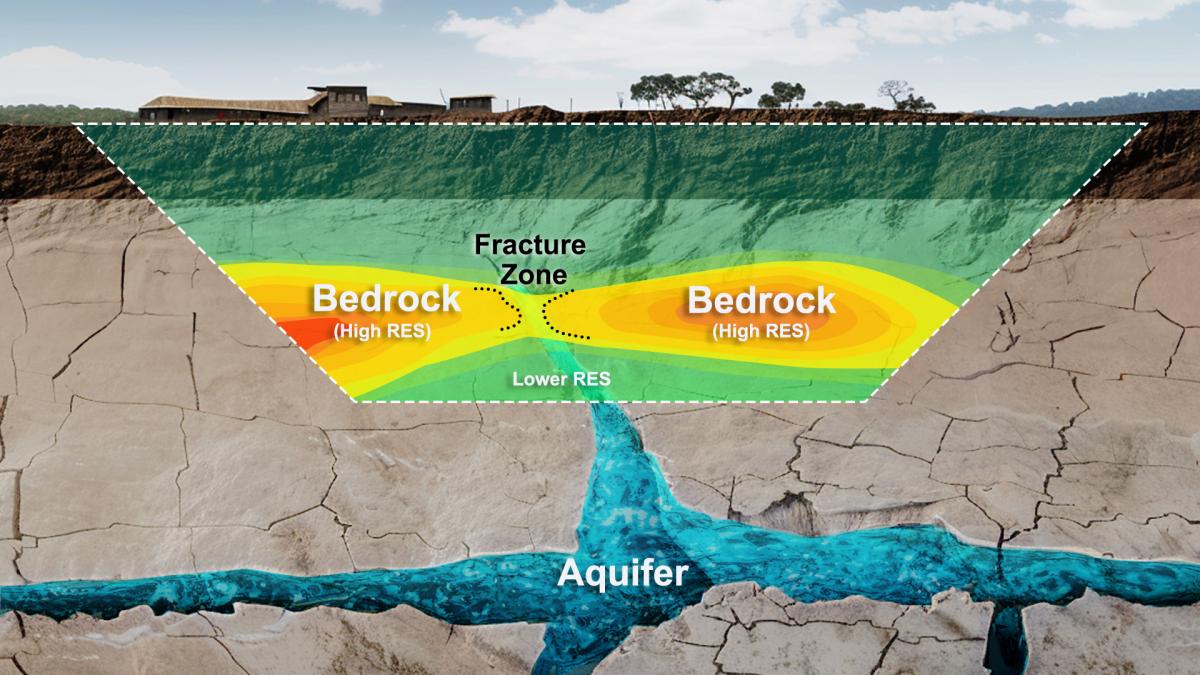
On the other hand, if you're surveying in hard rock, you should focus on fracture zones. Linear or curvilinear patterns of altered resistivity can signify fractures and faults. These features may show sudden changes in resistivity across a line, indicating a geological boundary or a fracture zone. In a groundwater survey, you'll want to keep an eye on low resistivity values that appear in a fracture zone. These fracture zones are potential locations for successful well drilling into an aquifer. They can channel water flow and act as reservoirs or conduits for groundwater. To see a great case finding groundwater in faults, see this case history from Kenya: "Surveying For 600-Meter-Deep Groundwater In Kenya"
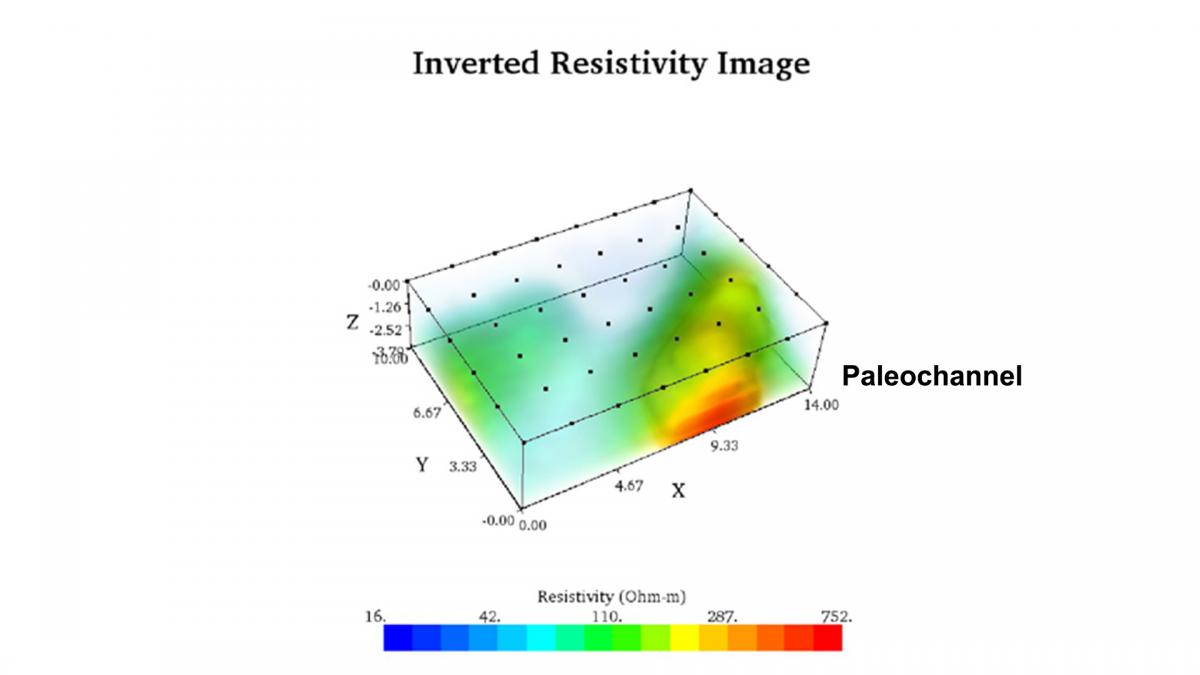
Additionally, look for patterns that may suggest the presence of paleochannels—ancient river or stream beds now filled with sediment. These features often appear as snaking, elongated anomalies in resistivity imaging, reflecting their historical paths and potential as significant groundwater reservoirs. See the image below for what that looks like in 3D, and see this case history about paleochannels: "Hermitage Springhouse 3D ERI Groundwater Mapping"
Pattern and Shape Recognition for Caves:
Caves, particularly air-filled ones, may present distinct, rounded anomalies with high resistivity. Understanding the shape and continuity of these anomalies is crucial. Rounded, smooth contours typically indicate voids, while jagged, irregular shapes might suggest rocky or uneven cave walls.
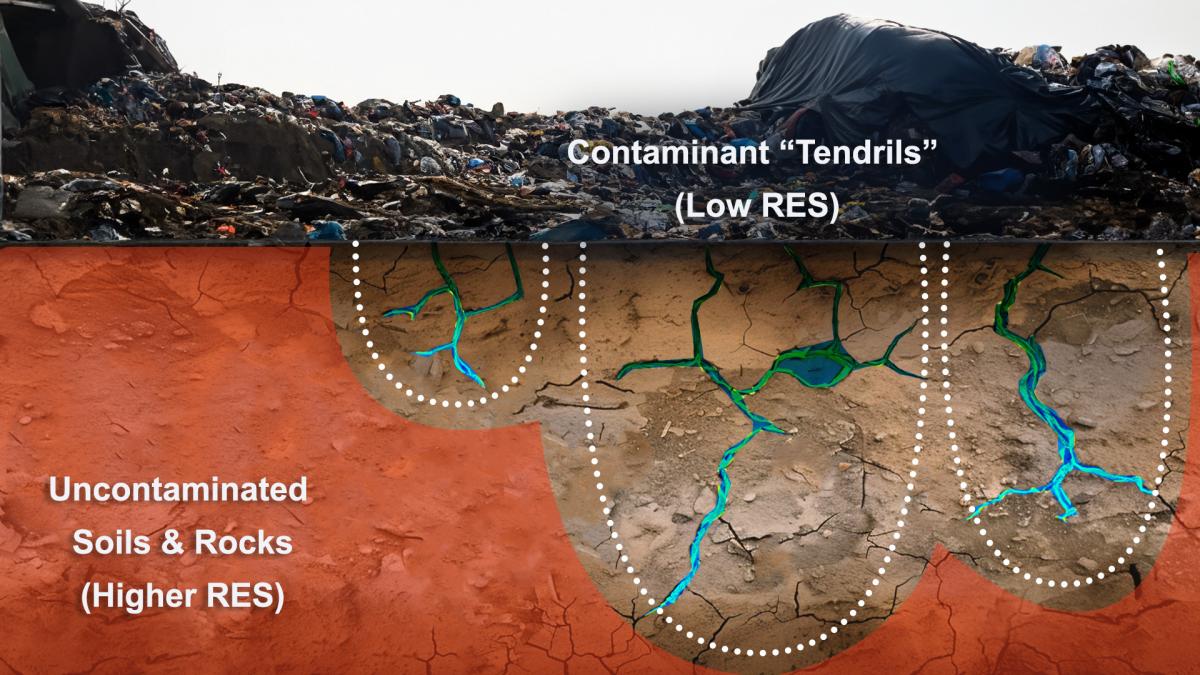
Pattern and Shape Recognition for Contaminant Plumes:
Identifying pollution plumes involves recognizing conductive "tendrils" from contamination sources, such as landfills. These "tendrils" will contrast sharply with higher resistivity values of uncontaminated soils and rocks. These plumes often follow fracture lines or the paths of least resistance, which are also avenues for groundwater flow.
This phenomenon, known as preferential flow, describes how water and its constituents rapidly move along preferred pathways through a porous medium. This movement through preferential pathways can quickly transport pollutants, such as pesticides and fertilizers, to groundwater, posing environmental risks. Recognizing these patterns requires careful consideration of both shape and conductivity gradients, as these can provide crucial insights into the extent and direction of pollution and groundwater movement. This is one of the many instances in which having the public records on hand will help—as groundwater flow may already be mapped in the area.
Check out this user case to see an assessment of affected subsurface by biological waste pollutants from pig farms: "Biowaste Infiltration Assessment"
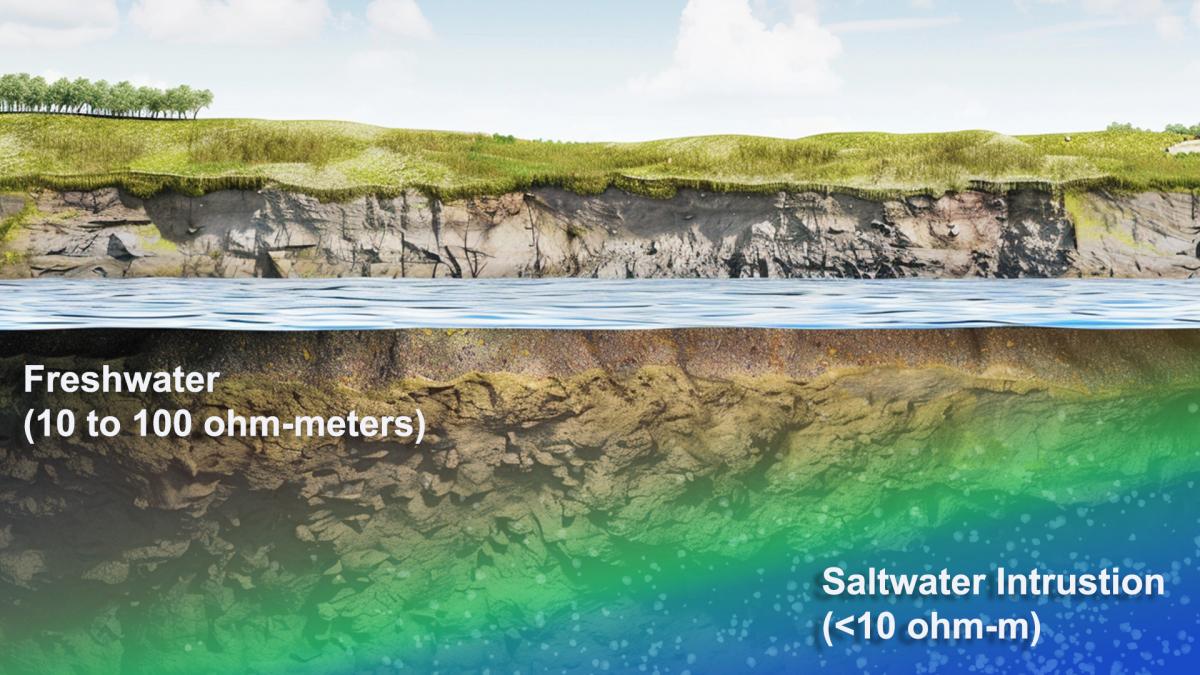
Interpreting Saltwater Intrusion (Marine Surveys):
Saltwater intrusion into freshwater aquifers can be visualized in coastal areas as pockets or layers of high conductivity within normally resistive freshwater-bearing formations. The mixing zone of salt and freshwater may appear as a gradient of increased conductivity towards the coastline.
Advanced Interpretative Techniques
3D ERI Modeling:
Three-dimensional modeling provides a comprehensive view of the subsurface, allowing for more precise identification and analysis of geological features. This technique is invaluable in complex scenarios where two-dimensional data might fall short.
Data Processing and Error Analysis:
Rigorous data processing techniques, including noise filtering and signal enhancement, coupled with stringent quality control measures, ensure the accuracy and reliability of the interpretive output. To learn more about acceptable data filtering, read this blog article: "Is it ok to remove noisy data?"
Pair ERI With Other Geophysical Methods:
Geophysicists usually use various techniques, including ground-penetrating radar (GPR), seismic methods, and Electrical Resistivity Imaging (ERI)—to ensure the accuracy and robustness of their findings. These methods complement each other and can compensate for any gaps of information that may arise if a single method is used alone.
Why Correct Interpretation Is Critical
Inaccurate Risk Assessment:
Misidentifying the location, size, or existence of voids can lead to catastrophic outcomes, especially in urban or industrial settings. Such oversights may result in structural failures or subsidence, posing significant risks to human lives and property.
Faulty Resource Allocation:
Incorrect readings can lead to unnecessary exploratory drilling or excavation, wasting time and resources. Conversely, underestimating the extent of a void or missing it altogether could result in inadequate investigation and preparation, potentially causing surprises during later construction phases.
Environmental Impact:
In environmental geophysics, misinterpreting voids, fractures, and adjacent material characteristics can affect groundwater flow models and contamination assessments, impacting strategies for environmental remediation.
Scientific and Technical Implications:
For research purposes, inaccurate data interpretation can result in erroneous geological or hydrological conclusions, adversely affecting scientific understanding and the progression of geophysical methodologies.
Conclusion
By adopting a comprehensive approach that considers all influencing factors—from geological settings and mineral content to moisture variations and advanced modeling techniques—you can significantly improve the accuracy and effectiveness of your subsurface explorations.

